")


Limiting resolution and MTF
For the image processor it is of interest to depict objects with a resolution (image sharpness, richness in detail) and contrast as high as possible. The image is supposed to realistically represent coarse and fine object textures in all areas. Unfortunately, this theoretic wishful thinking cannot be put into practice perfectly. It is apparent that particularly in case of fine object texture the contrast worsens, with the result that from a certain fineness on the features can no longer be evaluated by the software. This image quality impairment typically increases from the centre of the picture towards the picture margin.
In order to assess the resolution of the optics, chiefly the Modulation transfer Function (MTF) is consulted. These diagrams made available by the manufacturer provide information on how many parallel black-and-white pairs of lines are depicted in a differentiated way with which contrast – i.e. the more pairs of lines at the highest possible contrast, the better the lens.
But what is behind this?
Phenomenon of contrast reduction
The starting point is a test chart with an increasingly finer pattern of black-and-white bars (pairs of lines per millimetre) at an ideal, maximum object contrast of 100%. Then the resulting contrast of the individual bright-and-dark patterns can be measured in the reproduced image:
 |
It becomes apparent that the image contrast continuously decreases the finer the object texture. Edge pairs which could initially be called black and white are only dark grey and light grey afterwards.
When depicting the test chart, the structures become the "poorer in contrast" the greater the fineness and usually also the further towards the image margin. The highest optic performance of a lens is typically in the centre of the image. The finest structures which can only just be recognised with a "certain" remaining contrast represent the limiting resolution of the optics. The more contrast the optics provides for finest structures, the better it is.
An MTF diagram eventually plots the measured image contrast against pairs of lines / mm. However, other forms of representation are possible, too.
Optic limiting resolution
The reason for this contrast reduction is the diffraction of light at the slit. Due to the wave characteristic of light, which can be described as an electromagnetic wave, special effects occur. If the electromagnetic wave of light hits an obstacle, a new wave front is generated at the edge which can even spread out into the geometric shadowed space of the obstacle. In case of lenses, this "edge" is the circular aperture of the optics, the resulting diffraction patterns are concentric intensity distributions.
 |
The theoretic ideal signal is transformed into an intensity distribution which essentially represents a Bessel function of the first order. This diffraction pattern is also referred to as "airy disk".
 |
If the aperture is progressively closed, the little airy disks overlap. The signal overlapping leads to a reduction of the ideal theoretic black-and-white contrast of our test chart. The more the two signals converge, the lower the contrast in the image:
 |
The Rayleigh criterion assumes that two airy disks of the same intensity and colour can still be differentiated when the minimum of the first diffraction coincides with the maximum of the second. Between the two overlapping airy disks, the brightness drops to 75% of the maximum value. This corresponds to a remaining contrast of 14% (of the initial contrast). Two spots can only just be differentiated if in the image their maxima are at least apart by the radius r of the airy disk. In case of lower object contrasts and measuring applications, this information, however, must rather be judged critically.
The radius of the airy disk can be taken as the diffraction-related limiting resolution. There the signal peaks of the diffraction patterns are hardly overlapping, the remaining contrast is correspondingly high. Especially in case of non-ideal starting conditions which do not always provide an initial contrast of 100%, this is a useful assumption.
The radius of the first minimum of the diffraction pattern at the circular aperture is calculated from:
Rmin1 = 1.22 * wavelength of the light * effective focal ratio
The diameter of the diffraction disk is:
d= 2 * 1.22 * wavelength of the light * effective focal ratio
The diameter of the airy disk and thus the theoretic diffraction-related limiting resolution therefore depend on the wavelength, but in particular extremely on the aperture of the optics. From an aperture of 5.6 to 8 on, these values are already greater than the pixel structures of state-of-the-art digital image sensors.
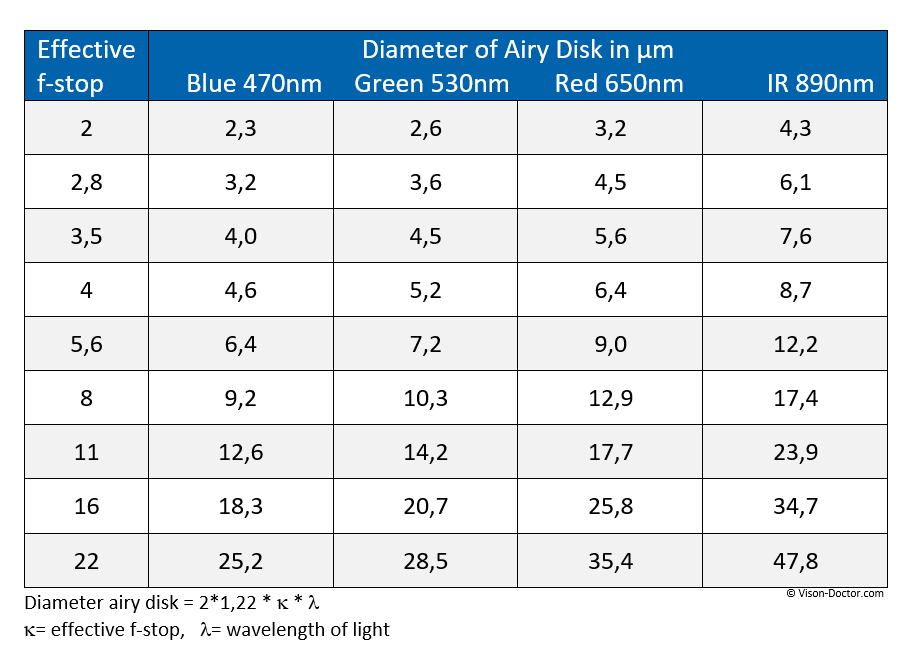 |
From an aperture of 5.6 to 8 on, these values are already greater than the pixel structures of state-of-the-art digital image sensors. The image signal is blurred to several neighbouring pixels, the image is poor in contrast and blurred.
This effect is especially visible when stopping down the optics to an extreme extent:
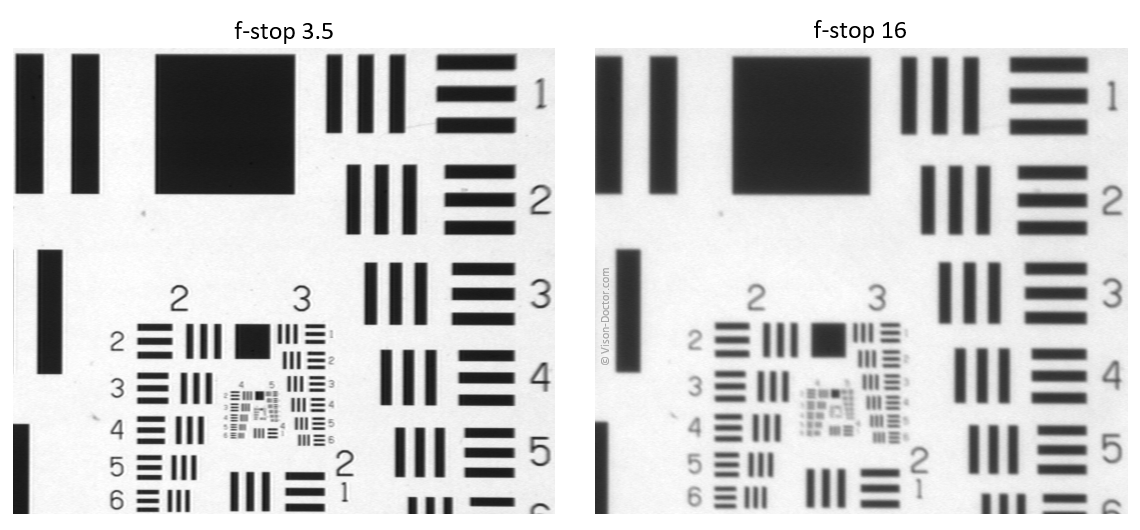 |
Despite the high-quality optics and camera, the image is extremely impaired when stopping down!
The MTF curve of the optics
The imaging performance of optics is indicated in an MTF diagram. It is always below the theoretic limitation of the optics due to diffraction effects. In doing so, the structure fineness (pairs of lines / mm) is plotted against the image contrast (first figure).
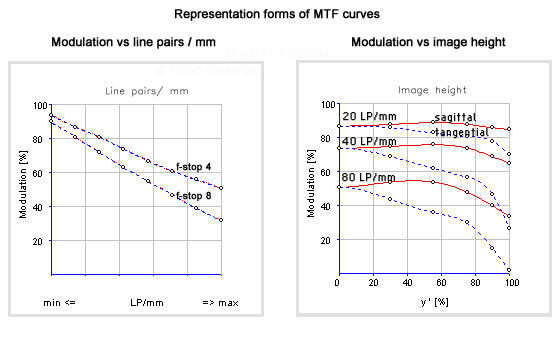 |
In addition to this form of representation, the modulation can also be depicted as a function of the image height. AS the imaging performance significantly worsens from the optic centre towards the image margin, this contrast function is often used by optics manufacturers, namely in tangential direction as well as sagittal (= radial) direction towards the optic centre of the lens.
The following applies in principle:
- The higher the modulation curves, the better the lens
- The closer tangential and sagittal curves, the better the imaging performance
- If the modulation drops below 20% in one area, the optics is probably not suitable for the inspection in this area.
Attention: the values exclusively refer to the optical imaging performance of the optics. In order to consider the MTF of the entire system, the MTF of the camera must be set off against the MTF of the optics!
Limiting resolution of the sensor
The CCD or CMOS sensor of the camera, too, essentially influences the limiting resolution of the overall system.
The theoretic resolution of a camera sensor is described by the Nyquist frequency:
Nyquist frequency = 1 / (2 * pixelsize)
According to the Nyquist sampling theorem, more than twice the frequency must be available for sampling a signal in order to approximate the original signal properly. Analogously, the sampling theorem also applies to images, with the sampling frequency to be determined in pixels or pairs of lines / mm.
For the individual image sensors there are clear differences in how many pairs of lines per millimetre can be resolved, as the pixel sizes of state-of-the-art camera sensors in machine vision range from approx. 3.5 to 14 µm. This results in a theoretic physical resolution capacity of 7 to 28 µm when reproducing finest structures.
However, this alone does not necessarily make a statement on the measuring accuracy...
Combined limiting resolution = measuring accuracy of the overall system?>
A difficult subject! The limiting resolution of optics and sensor must be multiplied in order that the MTF of the overall system is always below the MTF limiting the imaging performance. This can be the Nyquist frequency of the sensor, but also the MTF of the optics. Unfortunately, normal users can seldom determine MTF curves themselves and can only look at the resulting pictures.
In practice, however, this means that finest object textures and the edges of the object are depicted in a slightly blurred manner. In the image there are basically always slight grey graduations at the object edges representing these unsharpness ranges.
Any structures even finer than 5 - 7 µm are not necessarily recognisable, but under certain conditions the measuring can be more precise using sub-pixeling methods (mathematical interpolations of the shades of grey)! A factor of 3 to 4 of higher accuracy can well be gained, nevertheless this factor only depends on the quality of the underlying algorithm.
It becomes apparent again that a sensor with larger pixels, which theoretically has a worse Nyquist frequency and thus resolves fewer pairs of lines per mm, can possibly provide an essentially more accurate measuring result due to the higher full well capacity and lower sensor noise.
Conclusion:Always ask advice and the know-how of experts for such discussions. Many important details for this discussion cannot necessarily be taken from data sheets and absolute product knowledge is required here in order to compare and ideally combine similar components from different manufacturers. Do carry out thorough measuring system analyses yourself!